Power of Data


Description
The project is based on an analysis of the invisibility of data and social networks, which have increased their use in people's daily lives. Who has the power of data? Where is the data stored? Am I in control of the information I share? These are some of the key questions from which the project is born. The potential power of social networks and their growth stems from two factors, taking advantage of the human need to communicate and socialise with others. For the concept is based on the assumption that people have a "physical self" and a "virtual self".
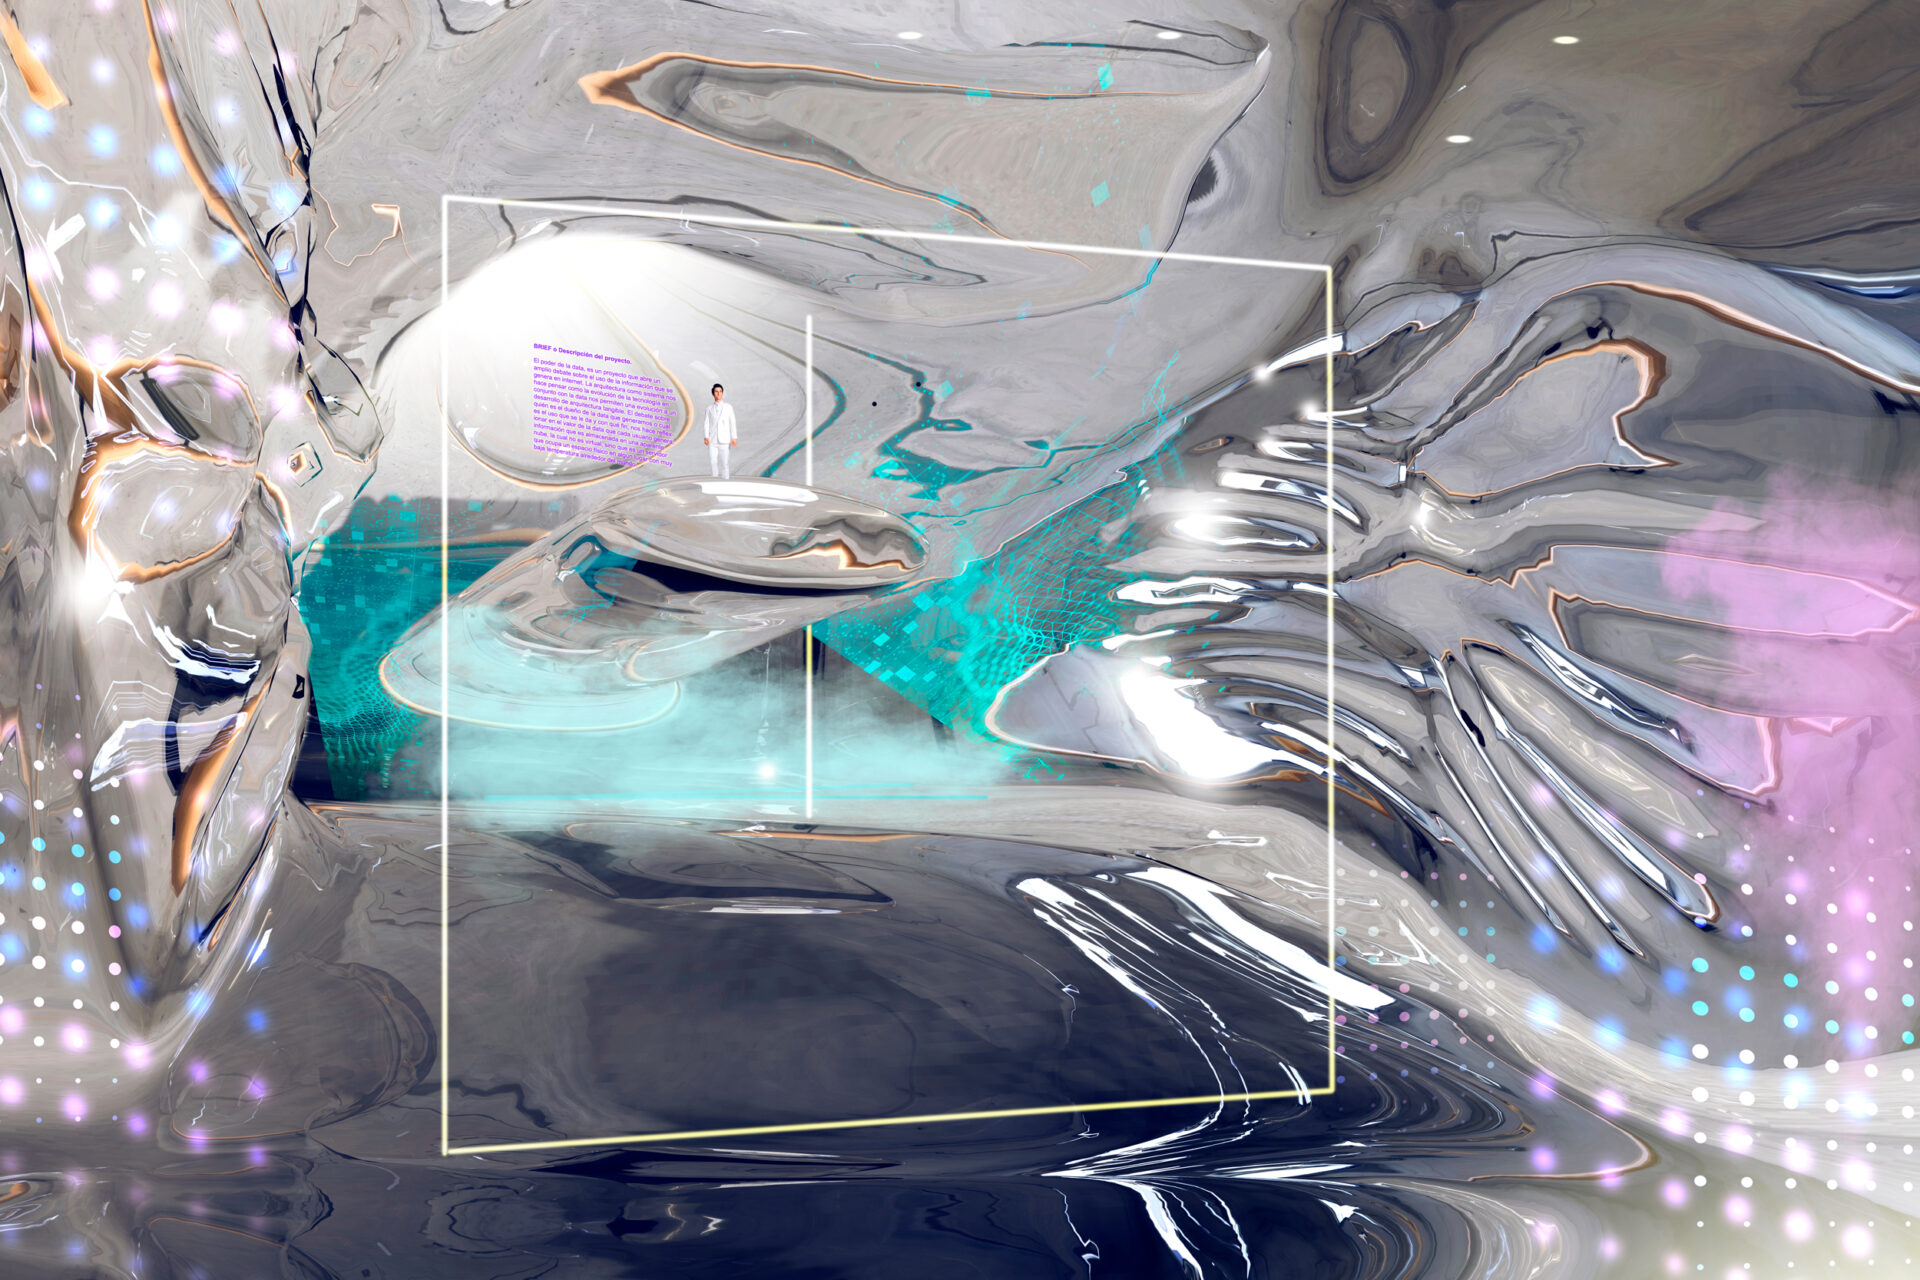
Therefore, the methodology of the project consists of transforming the data by using machine learning technologies and software that enables the coding, processing and utilisation of information from real social networks, with the aim of transforming the information from an intangible (data) state to a generated virtual architecture.
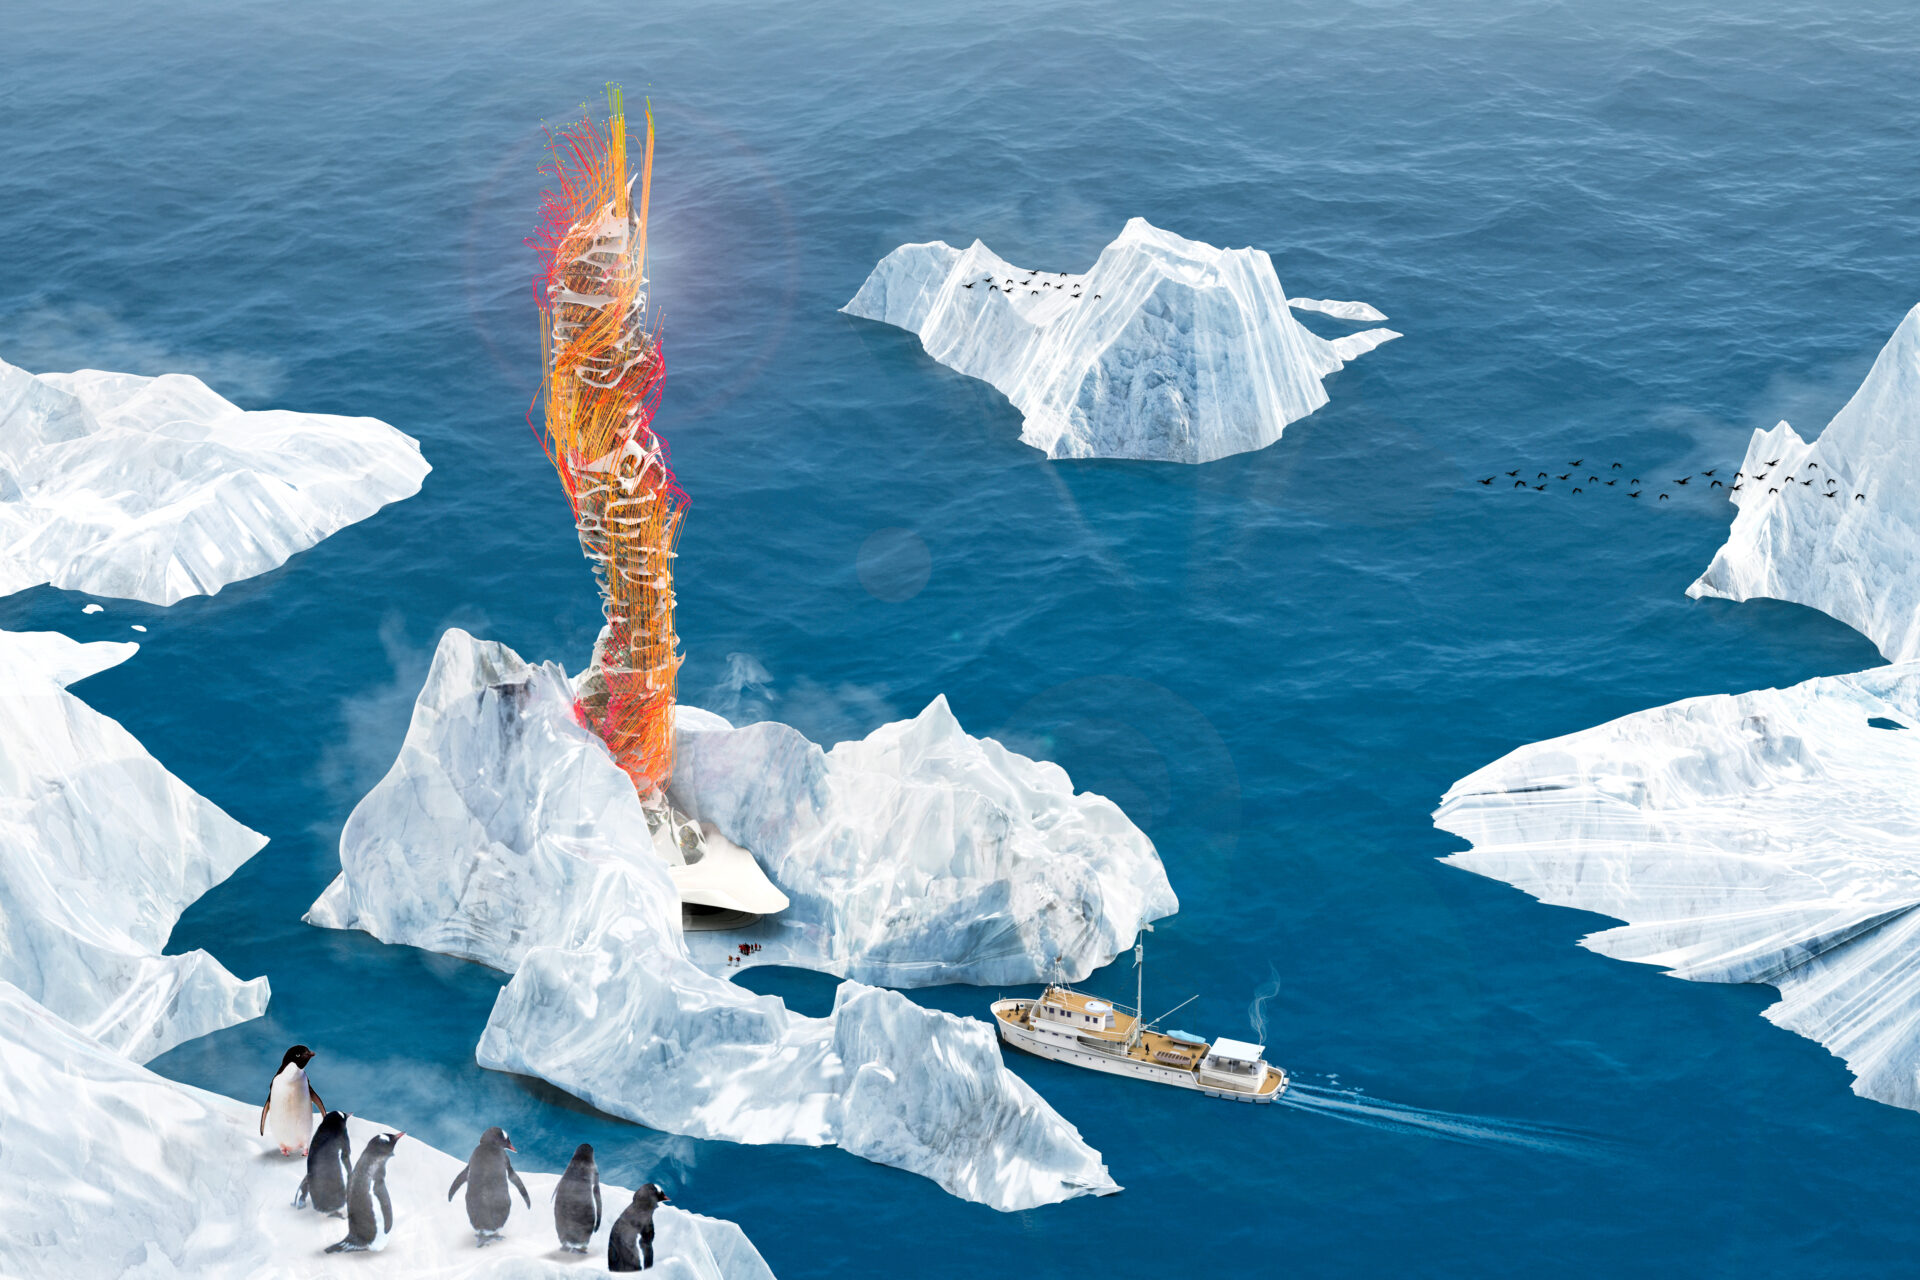
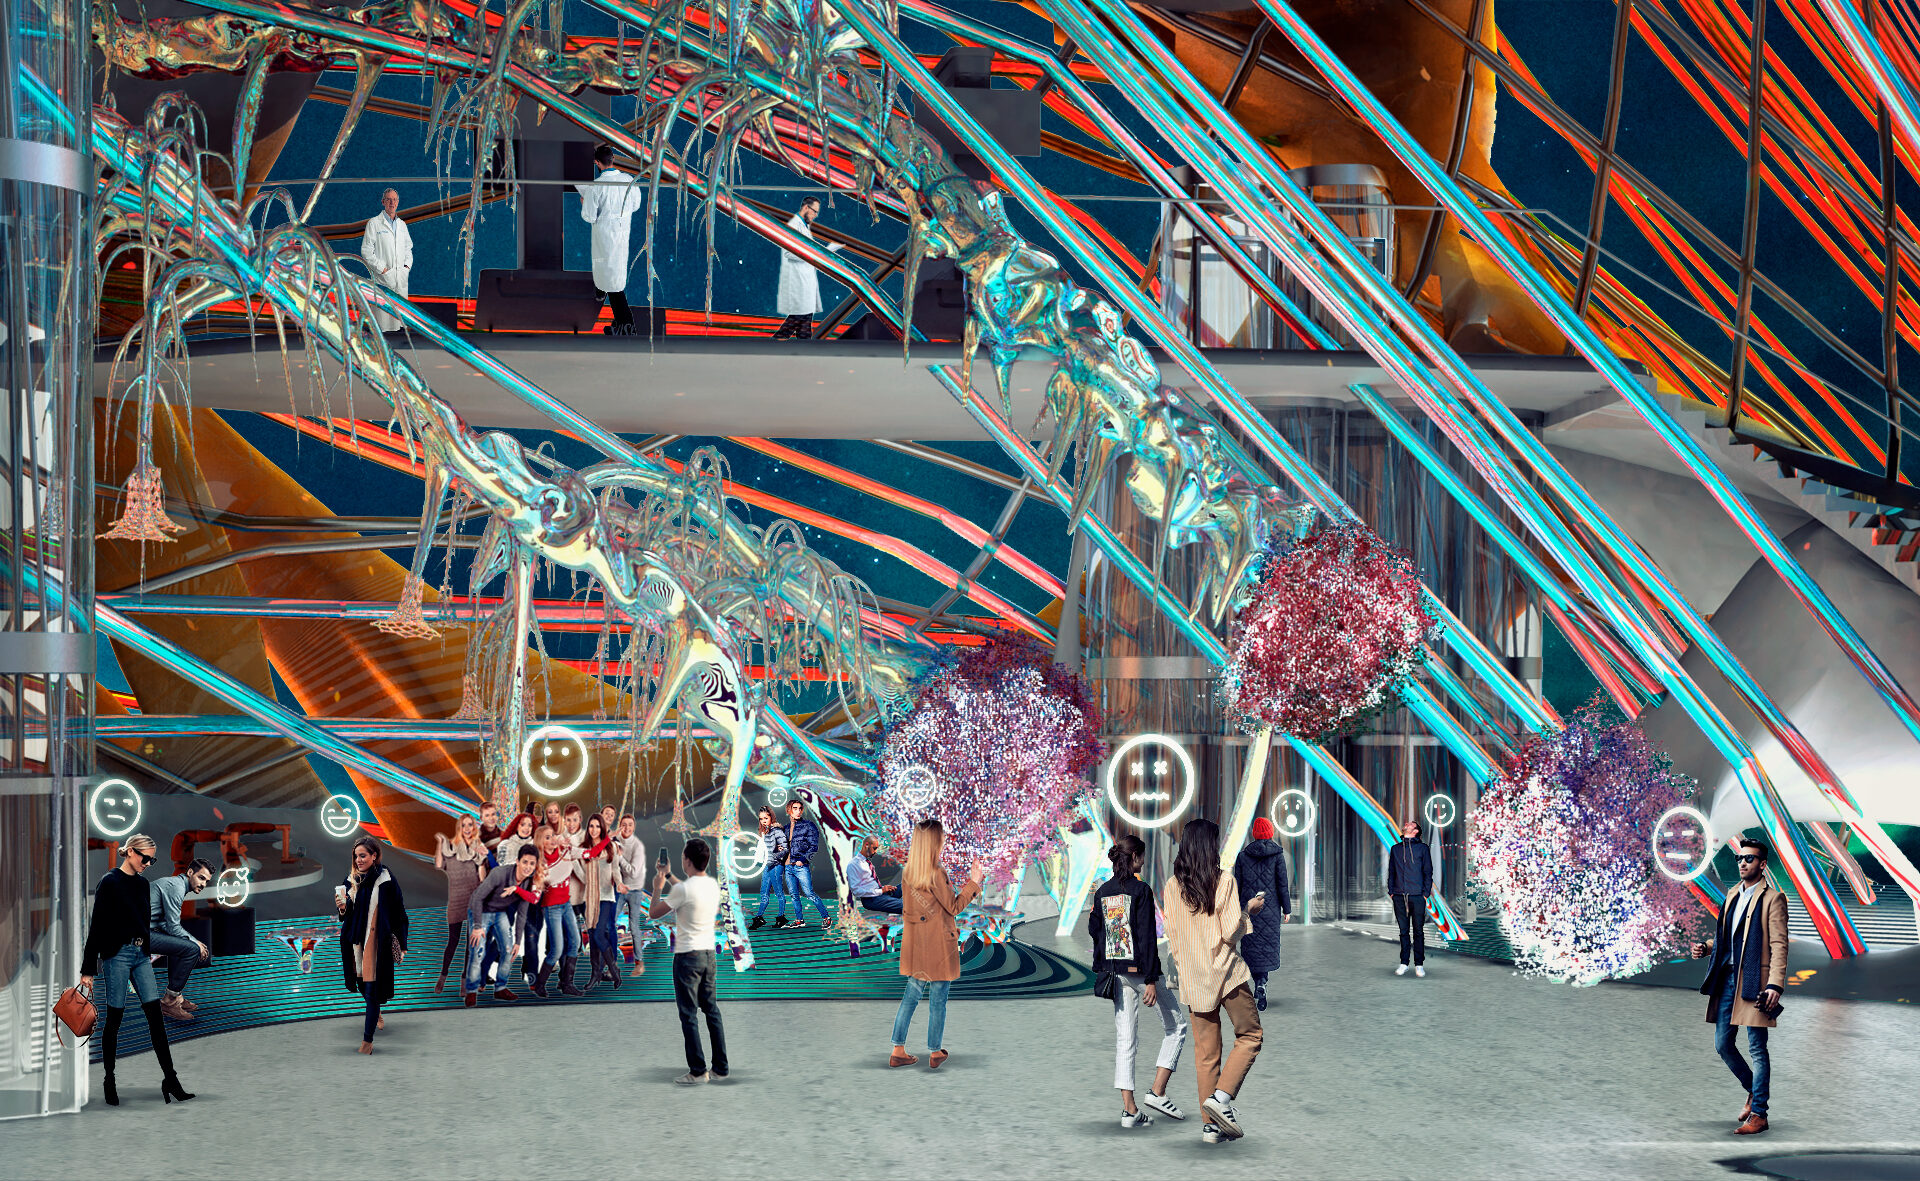
The final result is a building created by data and coding processes in different design and 3D modelling softwares. The tower created has the following characteristics: a structural grid, data vectors that run completely through it, thermal insulation and a 3D printed graphene structure. In this same way, 5 interactive sculptures were created, which transform the information obtained from social networks into geometry, creating a visual way of identifying the data. In addition, lifts, teleporters and musical instruments were designed as interactive components.

Tower of Data
In general, The Power of Data is an immersive and interactive experience, as it allows the simultaneous connection of different users in the virtual space. Therefore, an in-depth study of the spaces, sounds, lighting, dynamic textures and types of routes that enhance the sensations and interactions between the user and the building was carried out.
The architecture is organised on the basis of 3 temporal phases, which arise from the analogy of storing, processing and predicting data over time. The first zone is the virtual zone of the past (laboratory), the second is the current virtual zone (data sculptures) and finally there is the virtual zone of the future, which is the final phase of the project.
When you enter the virtual building, the first space that welcomes you is the lobby, where you can find ramps, lifts and the model of the building as a guide. The tour begins with the basements containing the laboratories. It is in the first basement that the process of creation of the building is explained through an exhibition of images. On the second level of the project, the process of creating the sculptures and handling the data is explained and exhibited. Finally, on the third level you can visit a sample of the images resulting from the artificial intelligence processes applied.
Credits
Jennifer Durand
Claudia Garcia
Daniel Escobar
Giovanna Pillaca
Jose Luis Vintimilla
Circular


